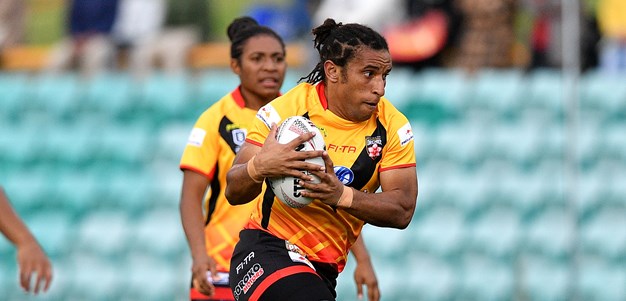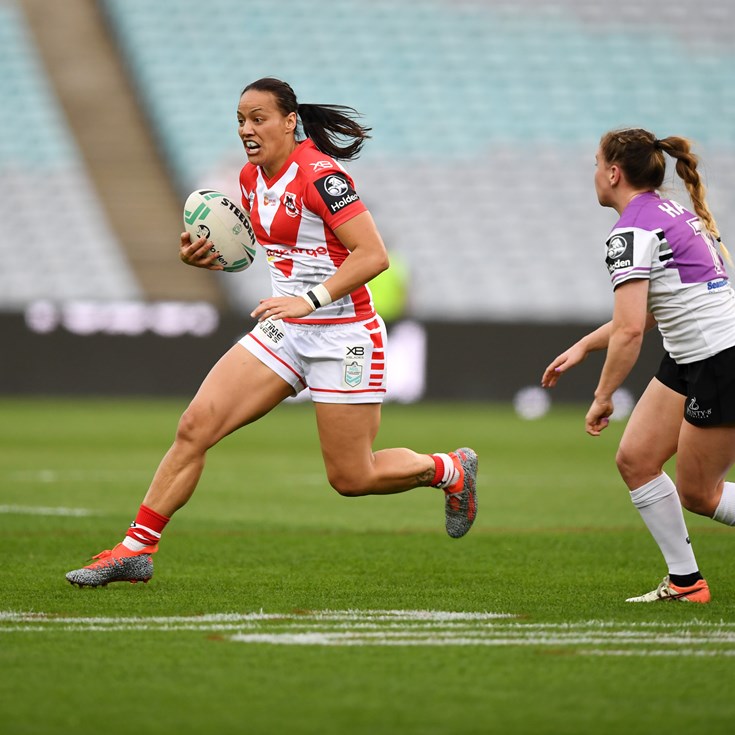

Steph Hancock
Prop
Player Bio
- Height:
- 173 cm
- Date of Birth:
- 09 March 1982
- Weight:
- 85 kg
- Birthplace:
- Killarney, QLD
- Age:
- 42
- Nickname:
- Steph
- Debut Club:
- Brisbane Broncos Women
- Date:
- 09 September 2018
- Opposition:
- St. George Illawarra Dragons Women
- Round:
- 1
- Previous Clubs:
- Brisbane Broncos Women, Gold Coast Titans Women
- Junior Club:
- Eastern Suburbs Hornets
- Biography:
One of the sport's pioneers, Hancock made her NRLW debut for the Broncos in the competition's inaugural season in 2018 and spent two seasons there before linking up with the Red V for a year.
Working with the police force away from football, she spent the past three seasons with the Titans scoring eight tries.
With two World Cup titles, 16 Queensland caps, and a record 33 NRLW appearances under her belt, Hancock brings one of the sport's great legacies to the Red V.
Hancock and father Rohan became the first father-daughter duo to represent both their country and state in rugby league.
Career
- Appearances
- 40
- Tries
- 8
2024 Season
- Appearances
- 7
Scoring
- Tries
- 0
Attack
- Tackle Breaks
- 7
- Average Hit Ups
- 5.7
- Post Contact Metres
- 217.5
Passing
- Offloads
- 7
Defence
- Tackles Made
- 62
- Tackle Efficiency
-
Running Metres
- Average Running Metres
- 72
- Total Running Metres
- 507
Fantasy
- Total Points
- 127
- Average Points
- 18.1
2024 Season - By Round
| Round | Opponent | Score | Position | Minutes Played | Tries | Goals | 1 Point Field Goals | 2 Point Field Goals | Points | Try Assists | Linebreaks | Tackle Breaks | Post Contact Metres | Offloads | Receipts | Tackles Made | Missed Tackles | Total Running Metres | Hit Up Running Metres | Kick Return Metres | |
|---|---|---|---|---|---|---|---|---|---|---|---|---|---|---|---|---|---|---|---|---|---|
| 1 | Titans | Lost | 10 - 18 | Prop | 30 | - | - | - | - | - | - | - | - | 18 | 1 | 5 | 11 | 3 | 45 | 45 | - |
| 2 | Cowboys | Lost | 38 - 34 | Interchange | 22 | - | - | - | - | - | - | - | - | 41 | 1 | 7 | 7 | - | 74 | 74 | - |
| 3 | Knights | Won | 10 - 18 | Interchange | 13 | - | - | - | - | - | - | - | - | 11 | 1 | 4 | 4 | 1 | 35 | 14 | 12 |
| 4 | Roosters | Lost | 8 - 28 | Replacement | - | - | - | - | - | - | - | - | - | - | - | - | - | - | - | - | - |
| 5 | Sharks | Lost | 4 - 28 | Interchange | 33 | - | - | - | - | - | - | - | 1 | 62 | 1 | 12 | 15 | 1 | 125 | 95 | 29 |
| 6 | Eels | Won | 14 - 42 | Interchange | 20 | - | - | - | - | - | - | - | 4 | 55 | 1 | 12 | 8 | - | 123 | 97 | 25 |
| 7 | Raiders | Lost | 34 - 38 | Interchange | 12 | - | - | - | - | - | - | - | 1 | 13 | 2 | 6 | 4 | - | 57 | 26 | 30 |
| 9 | Broncos | Lost | 14 - 44 | Interchange | 22 | - | - | - | - | - | - | - | 1 | 18 | - | 5 | 13 | 4 | 45 | 32 | 12 |
Career By Season
| Year | Played | Won | Lost | Drawn | Win % | Tries | Goals | 1 Point Field Goals | 2 Point Field Goals | Points | Kicking Metres | Kicking Metres Average | Tackle Breaks | Post Contact Metres | Offloads | Tackles Made | Missed Tackles | Tackle Efficiency | Total Running Metres | Average Running Metres | Kick Return Metres | Total Points | Average Points | |
|---|---|---|---|---|---|---|---|---|---|---|---|---|---|---|---|---|---|---|---|---|---|---|---|---|
| Broncos | 2018 | 4 | 4 | - | - | 100% | - | - | - | - | - | - | - | 7 | 90 | 1 | 59 | 5 | 92.19% | 220 | 55.00 | 34 | 87 | 21.8 |
| Broncos | 2019 | 4 | 3 | 1 | - | 75% | - | - | - | - | - | - | - | 5 | 109 | 7 | 68 | 2 | 97.14% | 260 | 65.00 | 31 | 114 | 28.5 |
| Dragons | 2020 | 3 | - | 3 | - | - | - | - | - | - | - | 123 | 40.93 | 3 | 82 | 2 | 63 | 9 | 87.50% | 192 | 64.00 | - | 77 | 25.7 |
| Titans | 2021 | 6 | 3 | 3 | - | 50% | 4 | - | - | - | 16 | 28 | 4.73 | 13 | 167 | 8 | 101 | 9 | 91.82% | 461 | 76.00 | 32 | 228 | 38.0 |
| Titans | 2022 | 5 | 1 | 4 | - | 20% | 4 | - | - | - | 16 | 25 | 5.00 | 11 | 181 | 7 | 99 | 7 | 93.40% | 443 | 88.00 | 13 | 212 | 42.4 |
| Titans | 2023 | 11 | 8 | 3 | - | 73% | - | - | - | - | - | 2 | 0.21 | 19 | 388 | 12 | 136 | 14 | 90.67% | 826 | 75.00 | 64 | 262 | 23.8 |
| Dragons | 2024 | 7 | 2 | 5 | - | 29% | - | - | - | - | - | - | - | 7 | 218 | 7 | 62 | 9 | 87.32% | 507 | 72.00 | 111 | 127 | 18.1 |
Career Overall
| Year Start | Year End | Played | Won | Lost | Drawn | Win % | Tries | Goals | 1 Point Field Goals | 2 Point Field Goals | Points | Kicking Metres | Kicking Metres Average | Tackle Breaks | Post Contact Metres | Offloads | Tackles Made | Missed Tackles | Tackle Efficiency | Total Running Metres | Average Running Metres | Kick Return Metres | Total Points | Average Points | |
|---|---|---|---|---|---|---|---|---|---|---|---|---|---|---|---|---|---|---|---|---|---|---|---|---|---|
| Broncos | 2018 | 2019 | 8 | 7 | 1 | - | 88% | - | - | - | - | - | - | - | 12 | 200 | 8 | 126 | 7 | 94.74% | 481 | 60.00 | 65 | 200 | 25.0 |
| Dragons |
2020
2024 |
2020
2024 |
10 | 2 | 8 | - | 20% | - | - | - | - | - | 123 | 11.16 | 10 | 300 | 9 | 125 | 18 | 87.41% | 699 | 63.00 | 111 | 204 | 20.4 |
| Titans | 2022 | 2023 | 22 | 12 | 10 | - | 55% | 8 | - | - | - | 32 | 56 | 2.53 | 43 | 736 | 27 | 336 | 30 | 91.80% | 1,731 | 78.00 | 110 | 702 | 31.9 |
Latest
Team Mates

St George Illawarra Dragons respect and honour the Traditional Custodians of the land and pay our respects to their Elders past, present and future. We acknowledge the stories, traditions and living cultures of Aboriginal and Torres Strait Islanders peoples, where our games are played, our programs are conducted and in the communities we support.
